
Grade 3/Data & Graphing
Venn Diagram Scenarios III (1207)
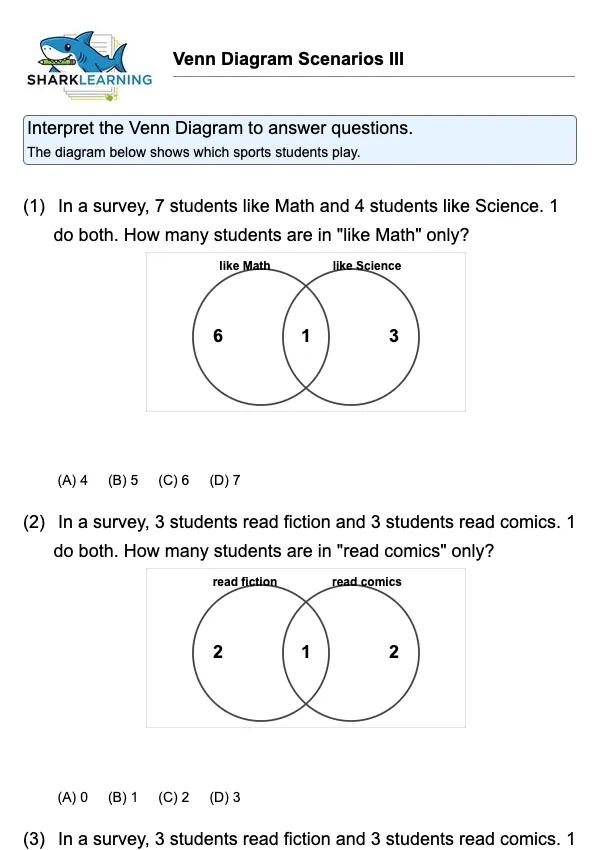
Interpret a Venn Diagram about sports participation.
9
Sheets
1396
Views
183
Downloads
Preview
Click to preview collection
Quick Tip
The diagram below shows which sports students play.
Teacher Resources
Teaching Notes
Discuss how 'At least two' includes 'Exactly two' and 'All three'.
Vocabulary
Intersection: Items in both sets.
Union: Items in either set.
Common Mistakes
- Counting the center twice
- Confusing 'only' vs. 'total in set'
- Miscounting shared regions
- Ignoring students outside all sets
- Incorrectly summing categories
Differentiation
SupportUse different colors for each sport.
ChallengeCalculate percentages.
Discussion Questions
- Is it possible for the 'All 3' number to be larger than an 'Only' number?
- What does each overlapping section represent?
- How many students play exactly two of these sports?
- Why is it important to count the 'none' category?
- How could this diagram help organize other types of data?
Extension Activities
- Create a sports survey.
Parent Tip
Ask your child to sort toys into two groups, like 'red toys' and 'soft toys'.
Learning Path
Skill Cluster
Data Analysis and Logic
Estimated Time
15 minutes
Skills Practiced
data interpretation
Prerequisites
- 1206
- Classifying Objects
- Counting Categorical Data
- Basic Set Concepts
Next Steps
- Probability with Venn Diagrams
- Categorical Data Analysis
- Boolean Logic
- Venn Diagram Scenarios IV
- Two-Set Venn Diagram Interpretation
- Categorical Data Tables