
Grade 3/Data & Graphing
Venn Diagram Scenarios II (1206)
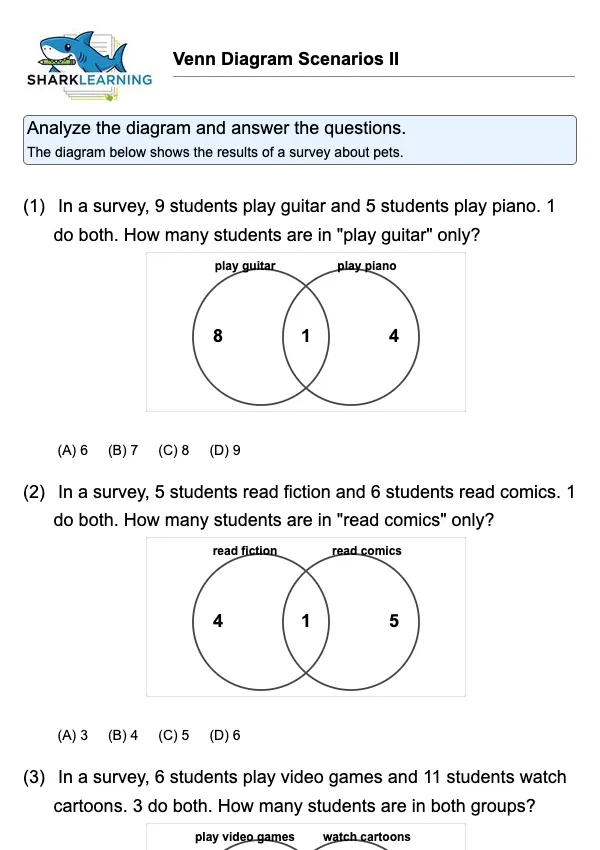
Analyze a survey about pets using a Venn Diagram.
9
Sheets
1118
Views
145
Downloads
Preview
Click to preview collection
Quick Tip
The diagram below shows the results of a survey about pets.
Teacher Resources
Teaching Notes
Help students break down the diagram into parts.
Vocabulary
Intersection: Items in both sets.
Union: Items in either set.
Common Mistakes
- Misinterpreting 'Both' vs 'Only'
- Misinterpreting 'only' vs. 'total'.
- Double-counting shared elements.
- Incorrectly placing numbers.
- Overlooking the 'none' region.
Differentiation
SupportHighlight the relevant circles.
ChallengeCreate your own scenario.
Discussion Questions
- What does the outside number mean?
- What does the center region represent?
- How is 'only cats' different from 'cats'?
- Can we represent this data in another way?
- Why are Venn diagrams useful?
Extension Activities
- Survey the class.
Parent Tip
Ask your child to sort toys into two groups, like 'red toys' and 'soft toys'.
Learning Path
Skill Cluster
Data Analysis and Logic
Estimated Time
15 minutes
Skills Practiced
data interpretation
Prerequisites
- 1205
- Basic set concepts
- Reading simple data charts
Next Steps
- Solving multi-step data problems
- Conditional probability concepts
- Venn Diagram Scenarios I
- Data Interpretation with Tables
- Problem Solving with Diagrams