
Grade 4/Data & Graphing
Line Plots with Fractional Data (1208)
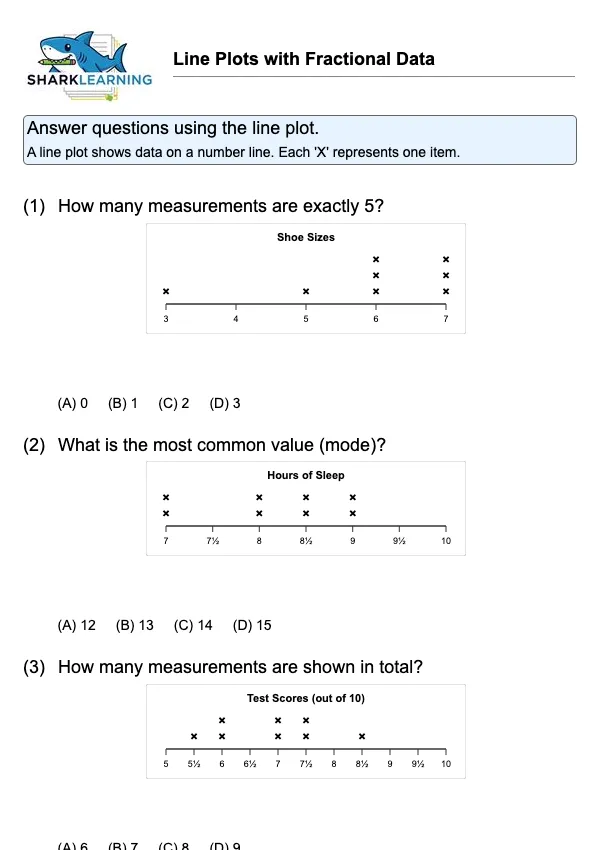
Interpret data displayed on a line plot with fractional intervals.
9
Sheets
1890
Views
247
Downloads
Preview
Click to preview collection
Quick Tip
A line plot shows data on a number line. Each 'X' represents one item.
Teacher Resources
Teaching Notes
Ensure students understand that each X represents one object, not the value itself.
Vocabulary
Line Plot: Graph showing data with X's above numbers.
Frequency: How often something occurs.
Common Mistakes
- Adding the values instead of counting the X's
- Miscounting 'X' marks.
- Incorrectly reading fractional intervals.
- Confusing number line scale.
- Errors with fraction calculations.
Differentiation
SupportCircle the X's as you count them.
ChallengeCalculate the total length of all pencils combined.
Discussion Questions
- Why do we use line plots?
- Why is a line plot useful for this data?
- What does each 'X' represent?
- How would the plot change with more data?
- Can you find the average pencil length?
Extension Activities
- Measure items in the classroom and make a line plot.
Parent Tip
Measure items at home (e.g., toy car lengths) and create a simple line plot.
Learning Path
Skill Cluster
Data Analysis & Fractions
Estimated Time
15 minutes
Skills Practiced
line plotsfractions on number line
Prerequisites
- 1201
- Reading number lines with fractions
- Basic fraction comparison
- Counting and data representation
Next Steps
- Calculating mean/median from line plots
- Creating line plots from raw data
- Line plots with smaller fractional units (e.g., eighths)
- Adding Fractions with Like Denominators
- Data Tables and Bar Graphs
- Measuring with a Ruler to the Nearest Quarter Inch