
Grade 4/Data & Graphing
Completing Venn Diagrams (1203)
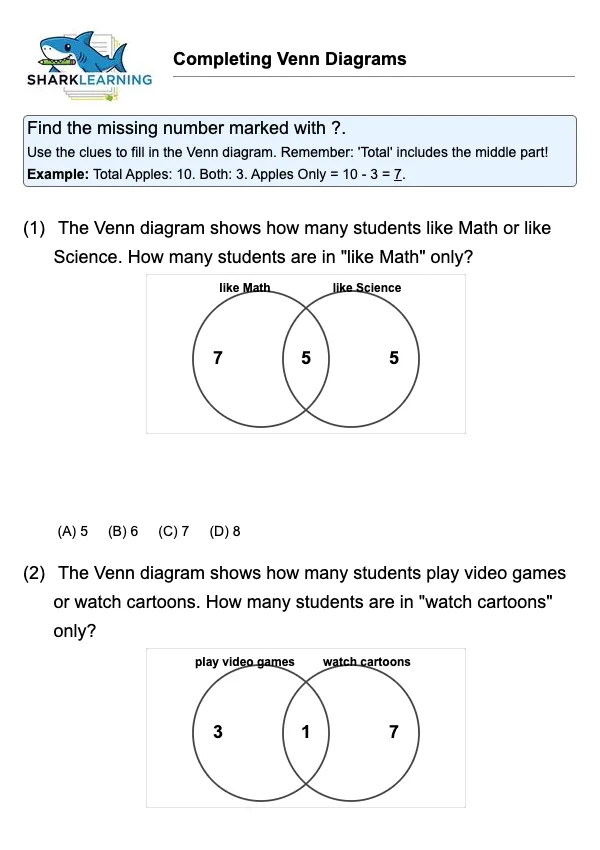
Use given data to find missing numbers in a Venn Diagram.
18
Sheets
1798
Views
421
Downloads
All Worksheets
⭐ Easy6
📊 Medium6
Preview
Click to preview collection
Quick Tip
Use the clues to fill in the Venn diagram. Remember: 'Total' includes the middle part!
Teacher Resources
Teaching Notes
Encourage students to write the 'Total' number next to the label (e.g., 'Dogs (12)').
Vocabulary
Total: The entire amount in a set.
Subtract: Take away a part from the whole.
Common Mistakes
- Subtracting the 'Only' part from the Total instead of the 'Both' part
- Double-counting the intersection
- Confusing 'total' with sum of visible regions
- Not subtracting intersection for unique values
- Misinterpreting 'likes both' vs. 'likes A'
Differentiation
SupportUse counters to represent the total and move them into the circles.
ChallengeTry problems with 3 circles.
Discussion Questions
- If I know the 'Only' parts and the 'Both' part, how do I find the Total?
- What does the overlapping part mean?
- How is this useful for organizing data?
- How do you find people who only like A?
- What if everyone liked both things?
Extension Activities
- Create your own Venn diagram survey for the class.
Parent Tip
Give your child 10 stickers. Take away 3. Ask how many are left.
Learning Path
Skill Cluster
Data Analysis and Logic
Estimated Time
15 minutes
Skills Practiced
venn diagram construction
Prerequisites
- 1201
- Understanding categories
- Basic addition and subtraction
- Interpreting simple data
Next Steps
- Solving problems with three sets
- Probability with Venn Diagrams
- Analyzing Bar Graphs
- Solving Word Problems with Data
- Categorizing Data